Loading...
Searching...
No Matches
Data Flow Diagram
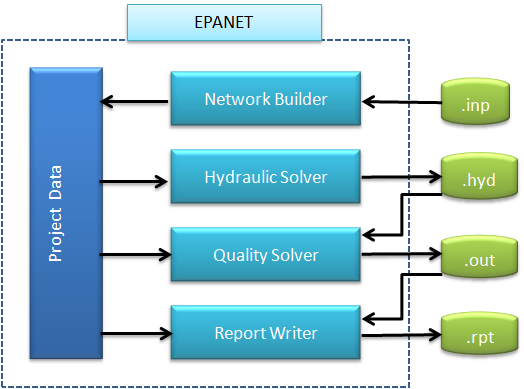
The EPANET Toolkit contains separate code modules for network building, hydraulic analysis, water quality analysis, and report generation. The data flow diagram for analyzing a pipe network is shown below. The processing steps depicted in this diagram can be summarized as follows:

|
- The network builder receives a description of the network being simulated either from an external input file (.inp) or from a series of function calls that create network objects and assign their properties via code. These data are stored in a Project data structure.
- The hydraulics solver carries out an extended period hydraulic simulation. The results obtained at every time step can be written to an external, unformatted (binary) hydraulics file (.hyd). Some of these time steps might represent intermediate points in time where system conditions change because of tanks becoming full or empty or pumps turning on or off due to level controls or timed operation.
- If a water quality simulation is requested, the water quality solver accesses the flow data from the hydraulics file as it computes substance transport and reaction throughout the network over each hydraulic time step. During this process it can write both the formerly computed hydraulic results as well as its water quality results for each preset reporting interval to an unformatted (binary) output file (.out). If no water quality analysis was called for, then the hydraulic results stored in the .hyd file can simply be written out to the binary output file at uniform reporting intervals.
- If requested, a report writer reads back the computed simulation results from the binary output file (.out) for each reporting period and writes out selected values to a formatted report file (.rpt). Any error or warning messages generated during the run are also written to this file.
Toolkit functions exist to carry out all of these steps under the programmer's control, including the ability to read and modify the contents of the Project data structure.